
Exosomes & Extracellular Vesicles
What Is Extracellular Vesicle Size and Why Does It Matter?
Extracellular vesicles exist across a range of nanoscale sizes. Here's what nanometer measurements mean, how D10, D50 and D90 describe a size distribution, and why size is one piece of characterization evidence rather than proof of identity.
When people first learn about extracellular vesicles, one of the first facts they usually encounter is that they are extremely small.
You may see numbers such as:
- 70 nanometers
- 100 nanometers
- 150 nanometers
or ranges such as:
- 30–200 nanometers
But what do those numbers actually mean?
Why does extracellular-vesicle size matter?
And can you identify an exosome simply by measuring how large it is?
The short answer is:
Particle size is an important part of extracellular-vesicle characterization, but size alone does not determine particle identity.
A size measurement can tell you something about the physical dimensions of the particles being detected.
It cannot, by itself, tell you exactly how those particles were formed or prove that every particle is an exosome.
What Is a Nanometer?
Extracellular-vesicle sizes are usually described in nanometers, abbreviated nm.
A nanometer is one-billionth of a meter.
That is:
1 nanometer = 0.000000001 meter
To put that into perspective, objects measured in nanometers are far too small to see with the naked eye.
Extracellular vesicles exist on this nanoscale.
That is one reason specialized analytical methods are needed to measure them.
Are All Extracellular Vesicles the Same Size?
No.
Extracellular-vesicle populations are heterogeneous.
That means the particles within one preparation can differ in:
- size
- molecular composition
- protein content
- biological origin
- other physical or biochemical characteristics
So rather than expecting every particle in a preparation to measure exactly 80 nm or exactly 100 nm, laboratories often report a particle-size distribution.
That gives a much more realistic picture than a single average number.
Small EVs and Large EVs
Researchers sometimes describe extracellular vesicles using operational size-based terms such as:
small EVs
and:
large EVs
MISEV2023 supports the use of operational terminology based on measurable characteristics when the precise biological origin of the particles has not been demonstrated.
You may therefore encounter terms such as:
small extracellular vesicles (sEVs)
rather than simply assuming that every nanoscale EV is an exosome.
That distinction matters.
Is a Small EV Automatically an Exosome?
No.
This is one of the most important lessons in extracellular-vesicle terminology.
As explained in Exosomes vs. Extracellular Vesicles: What's the Difference?, an exosome is defined by its biological formation pathway—not simply by particle diameter.
A particle measuring 80 nm may fall within a size range commonly associated with small extracellular vesicles.
That size measurement does not, by itself, prove that the particle originated through the endosomal pathway associated with exosome biogenesis.
So:
small particle ≠ automatically an exosome
and:
particle size ≠ biological origin
This is why careful EV terminology is important.
Why Measure Particle Size?
If size doesn't prove EV identity, why measure it?
Because particle size still tells us something useful about the preparation.
It can help researchers understand:
- the distribution of detected particles
- whether a preparation contains a narrow or broad size range
- whether different lots have similar physical profiles
- whether storage or processing may have changed particle characteristics
- how one sample compares with another when measured using comparable methods
- whether large particles or aggregates may be present
Size is therefore one important piece of characterization evidence.
It just isn't the entire picture.
Our guide Understanding Extracellular Vesicle Characterization and Testing explains how size fits together with particle count, protein markers and other measurements.
What Do D10, D50 and D90 Mean?
Instead of reporting only one average particle diameter, laboratories may report D10, D50 and D90 values.
These describe points within a cumulative particle-size distribution.
In simplified terms:
| Value | What It Describes |
|---|---|
| D10 | The diameter below which 10% of the reported cumulative particle-size distribution falls. |
| D50 | The median particle diameter. Half of the reported distribution falls below this diameter and half above it. |
| D90 | The diameter below which 90% of the reported cumulative particle-size distribution falls. |
These values help describe the spread of measured particle sizes.
A Simple Example
Imagine a sample with:
- D10 = 65 nm
- D50 = 80 nm
- D90 = 125 nm
That doesn't mean the sample contains only three particle sizes.
It means those three values describe different percentile points within the measured size distribution.
A Real HydroKarma Example
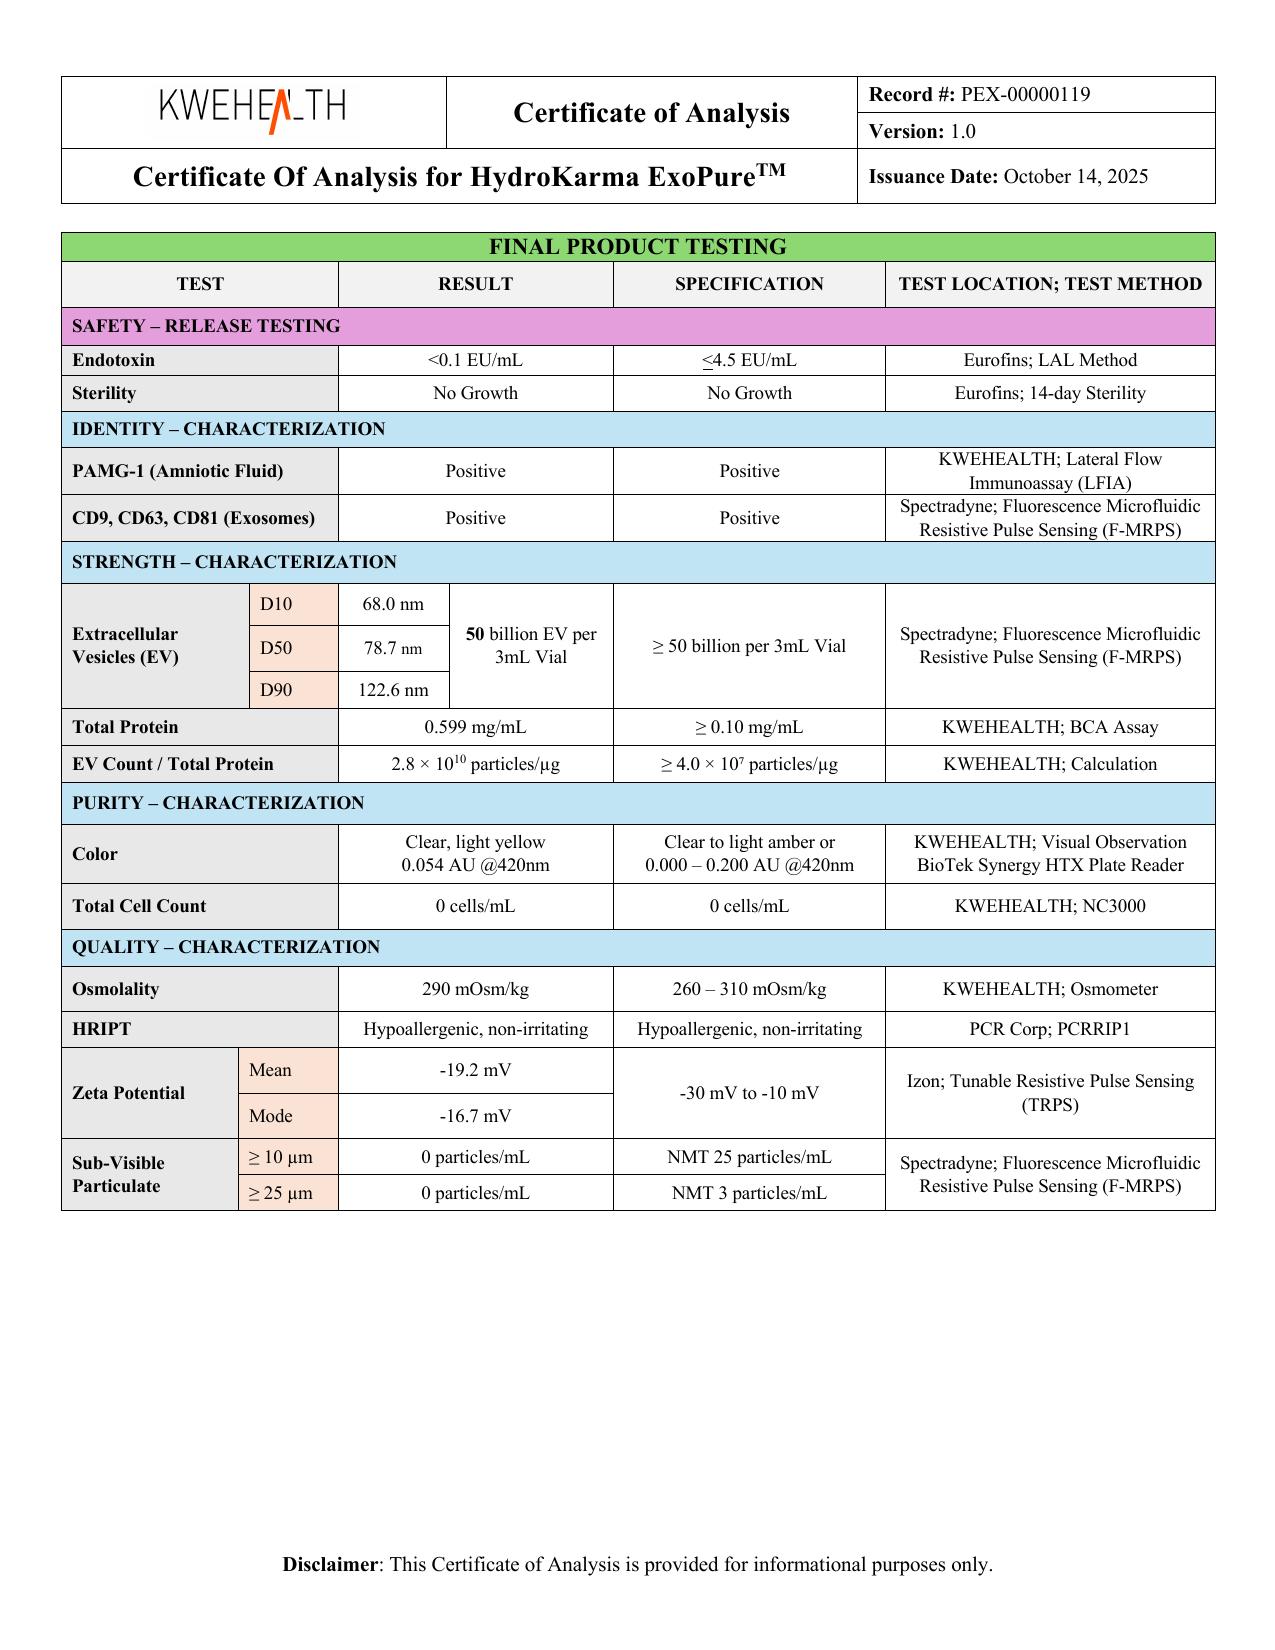
The KWEHEALTH/HydroKarma Certificate of Analysis for lot KH-0007DE reports:
| Measurement | Reported Result |
|---|---|
| D10 | 68.0 nm |
| D50 | 78.7 nm |
| D90 | 122.6 nm |
According to KWEHEALTH's batch-specific COA, these values were reported using:
Spectradyne; Fluorescence Microfluidic Resistive Pulse Sensing (F-MRPS)
The same COA reports:
- EV quantity: 50 billion EV per 3 mL vial
These results give us two different kinds of information:
- Particle quantity — how many particles were reported.
- Particle-size distribution — how the measured particle sizes were distributed.
That is more informative than looking at the quantity alone.
For a deeper explanation of these numbers, see Understanding Exosome Concentration and Particle Count.
What Does D50 = 78.7 nm Tell Us?
For lot KH-0007DE, the reported:
D50 = 78.7 nm
is the median of the reported cumulative size distribution.
That means approximately half of the reported distribution falls below 78.7 nm and half falls above it.
It does not mean:
- every particle is 78.7 nm
- the average particle is necessarily 78.7 nm
- every particle below 78.7 nm is an exosome
- every particle above 78.7 nm is not an exosome
D50 is a useful way of describing the center of the measured distribution.
It isn't an identity test.
What Do D10 and D90 Add?
D10 and D90 help show the spread of the distribution.
For KH-0007DE:
- D10 = 68.0 nm
- D90 = 122.6 nm
Together with D50, these measurements give a better picture of the reported size profile.
Instead of seeing only:
“78.7 nm”
we see:
68.0 nm → 78.7 nm → 122.6 nm
across the reported percentile values.
That helps the reader understand that the particle population contains a distribution of sizes rather than one uniform particle diameter.
Mean, Median and Mode Are Different
Another common source of confusion is the difference between mean, median and mode.
Mean
The arithmetic average of the measured values.
Median
The midpoint of the distribution.
Mode
The most frequently occurring value or region of the distribution, depending on how the measurement is reported.
These numbers can differ substantially when a particle-size distribution is skewed or contains multiple populations.
That is why it's important to look at the terminology used on the laboratory report instead of assuming every reported size value means the same thing.
How Is EV Size Measured?
Several analytical techniques can be used to measure particle size.
Examples include:
- nanoparticle tracking analysis
- resistive pulse sensing
- electron microscopy
- dynamic light scattering
- flow-cytometry-based approaches in certain size ranges
- other specialized particle-analysis techniques
These methods do not all measure particles in exactly the same way.
Van der Pol and colleagues compared extracellular-vesicle measurements obtained using transmission electron microscopy, flow cytometry, nanoparticle tracking analysis and resistive pulse sensing.
They found that measured particle-size distributions and concentrations can differ depending on the analytical technique and its detection limits.
That gives us an important rule:
A particle-size result should always be interpreted together with the method used to obtain it.
Why Can Different Methods Give Different Sizes?
Imagine trying to measure the same object using several different tools.
A ruler, camera, scanner and 3D sensor may all describe the object differently depending on what each tool detects and how the measurement is calculated.
Particle-analysis technologies work according to different principles too.
Some detect:
- light scattering
- electrical resistance changes
- electron interactions
- fluorescence
- hydrodynamic behavior
Each method has its own:
- detection range
- resolution
- sensitivity
- sample requirements
- assumptions
- potential biases
That doesn't mean one method is automatically correct and another incorrect.
It means the measurement method is part of the result.
How HydroKarma's Size Measurement Was Obtained
For lot KH-0007DE, KWEHEALTH identifies:
Fluorescence Microfluidic Resistive Pulse Sensing (F-MRPS)
as the reported method associated with its EV quantity and size-distribution measurements.
As discussed in Understanding Extracellular Vesicle Characterization and Testing, microfluidic resistive pulse sensing detects individual particles as they pass through a small sensing region and create changes in electrical resistance.
The fluorescence-enabled approach adds fluorescence-based detection capabilities.
The important point for someone reading the COA is straightforward:
The reported particle-size numbers are tied to a stated analytical method.
They are not simply descriptive marketing numbers.
Does Size Tell Us Anything About Purity?
Not by itself.
Particle size and purity answer different questions.
A preparation could contain many particles within an expected EV size range while also containing other nanoscale material.
Different particles can overlap in size.
So:
particle size ≠ purity
This connects directly to What Is Extracellular Vesicle Purity? How EV Purity Is Evaluated.
Purity requires broader characterization of the preparation rather than relying only on size measurements.
Does Size Tell Us Whether CD9, CD63 and CD81 Are Present?
No.
Again, those are separate measurements.
Particle-size analysis tells us something about physical dimensions.
Marker testing tells us whether selected proteins were detected.
For example, KWEHEALTH reports for KH-0007DE:
- CD9: Positive
- CD63: Positive
- CD81: Positive
Those marker results contribute different information from D10, D50 and D90.
Our article What Are CD9, CD63 and CD81? explains why these tetraspanins are commonly evaluated during EV characterization.
Can Particle Size Change During Storage?
Potentially, yes.
Research has shown that storage conditions and repeated freeze-thaw exposure can affect measured characteristics of some extracellular-vesicle preparations, including particle concentration and size distribution.
That doesn't mean every EV formulation responds identically.
But it illustrates why storage conditions can matter when comparing measurements over time.
Our guide What Is Cold-Chain Storage and Why Does It Matter? explains that issue in more detail.
Can Processing Affect Particle Size?
Processing can influence the characteristics of the final preparation too.
Different isolation and purification techniques may recover or enrich different particle populations.
Some processing conditions may also influence aggregation or recovery.
That's one reason researchers document both:
how EVs were isolated
and:
how the resulting preparation was characterized
See What Is Extracellular Vesicle Isolation and Purification? for a deeper explanation of EV separation methods.
Why Size Distribution Can Be More Useful Than One Number
Suppose two EV preparations both report:
Median particle size: 80 nm
They might initially look identical.
But imagine:
| Sample A | Sample B | |
|---|---|---|
| D10 | 70 nm | 40 nm |
| D50 | 80 nm | 80 nm |
| D90 | 100 nm | 220 nm |
Both have the same median.
But their overall distributions look very different.
That is why a distribution provides more information than one central value.
The Bigger Picture
Extracellular-vesicle size is important because it helps describe the physical characteristics of a particle population.
But size isn't identity.
It isn't purity.
It isn't biological origin.
And it isn't biological activity.
Instead, particle size is one piece of characterization evidence.
Combine it with:
- particle concentration
- EV-associated markers
- protein measurements
- purity-related assessment
- source information
- processing information
- other analytical measurements
and the preparation becomes much easier to understand.
The Bottom Line
Extracellular vesicles exist across a range of nanoscale sizes.
That's why laboratories often report particle-size distributions rather than describing every particle with one number.
For HydroKarma lot KH-0007DE, KWEHEALTH reports:
- D10: 68.0 nm
- D50: 78.7 nm
- D90: 122.6 nm
using Fluorescence Microfluidic Resistive Pulse Sensing (F-MRPS).
Those measurements describe the reported particle-size distribution for that particular lot.
They do not prove:
- that every particle is an exosome
- that every particle has the same diameter
- that particle size establishes purity
- that particle size establishes biological activity
The most useful way to interpret EV size is alongside the rest of the characterization data.
In other words:
Size tells you how big the particles are—not everything about what they are.
Original Source / References
- Welsh et al. — Minimal information for studies of extracellular vesicles (MISEV2023): From basic to advanced approaches. Journal of Extracellular Vesicles, 2024. DOI: 10.1002/jev2.12404, PMID: 38326288. MISEV2023 provides current guidance on EV terminology, size-based operational nomenclature and characterization.
- van der Pol et al. — Particle size distribution of exosomes and microvesicles determined by transmission electron microscopy, flow cytometry, nanoparticle tracking analysis, and resistive pulse sensing. Journal of Thrombosis and Haemostasis, 2014. DOI: 10.1111/jth.12602, PMID: 24818656. This paper directly compared multiple EV measurement approaches and demonstrated that measured size distributions and concentrations depend partly on the analytical technique used.
- KWEHEALTH/HydroKarma batch-specific Certificate of Analysis — Lot KH-0007DE. The HydroKarma-specific D10, D50 and D90 values, EV quantity and F-MRPS method discussed above come from KWEHEALTH's manufacturer-supplied batch documentation and are not findings of the independent scientific publications above.
Continue Learning
What Is Zeta Potential and Why Is It Measured?
Zeta potential is an electrokinetic measurement reported in millivolts. Here's what it describes for extracellular vesicles, why measurement conditions matter, and why it is not proof of purity, identity, stability or shelf life.
Understanding Exosome Concentration and Particle Count
A particle count can provide useful information about a sample, but the number needs context: how it was measured, the volume it represents, the size distribution, and what else may be present.
Understanding Extracellular Vesicle Characterization and Testing
Characterization is how laboratories measure and describe different properties of an extracellular-vesicle preparation — particle count, particle size, EV-associated markers, total protein and zeta potential — and why no single test describes everything.
What Is Extracellular Vesicle Purity? How EV Purity Is Evaluated
Extracellular vesicle purity is a multidimensional characterization question, not a single number on a Certificate of Analysis. Here's how particle counts, protein measurements, markers and particle-to-protein ratios each contribute — and what none of them establish alone.