
Exosomes & Extracellular Vesicles
Understanding Exosome Concentration and Particle Count
A particle count can provide useful information about a sample, but the number needs context: how it was measured, the volume it represents, the size distribution, and what else may be present.
When looking at extracellular-vesicle products or laboratory reports, you may see numbers such as 10 billion, 40 billion, or 100 billion particles.
At first glance, comparing those numbers seems simple:
More particles = more exosomes.
But extracellular-vesicle measurement is more complicated than that.
A particle count can provide useful information about a sample, but the number needs context. How the particles were measured, the volume being measured, the size distribution, and what else may be present in the sample all matter when interpreting the result.
Understanding these basics makes product specifications and Certificates of Analysis much easier to read.
What Does “Particle Count” Mean?
Particle count refers to the number of detectable particles measured within a sample.
Depending on how the result is reported, you might see:
- particles per milliliter
- particles per dose or vial
- total particles in a sample
- a concentration written in scientific notation, such as 5 × 10¹⁰ particles/mL
For example, 4 × 10¹⁰ particles/mL means:
40 billion particles per milliliter.
If a sample contains multiple milliliters, concentration and total particle count are not necessarily the same number.
Concentration vs. Total Particle Count
This distinction is important.
Imagine two containers:
| Sample | Concentration | Volume | Total particles |
|---|---|---|---|
| Sample A | 40 billion particles/mL | 1 mL | 40 billion × 1 mL = 40 billion total particles |
| Sample B | 20 billion particles/mL | 3 mL | 20 billion × 3 mL = 60 billion total particles |
Sample A has the higher concentration, but Sample B contains the greater total number of particles.
So when comparing numbers, always ask:
Is this number describing concentration—or the total number of particles?
How Are Extracellular Vesicles Counted?
Extracellular vesicles are far too small to count using ordinary microscopy.
Instead, laboratories use specialized analytical techniques.
One commonly used approach is nanoparticle tracking analysis, usually abbreviated NTA.
NTA illuminates particles suspended in liquid with a laser. A camera records the light scattered by particles as they move through the liquid.
The software tracks this movement—known as Brownian motion—and uses it to estimate particle size. Because the instrument also observes particles within a known sample volume, it can estimate particle concentration.
What Does NTA Actually Measure?
This is where an important distinction comes in.
Standard light-scattering NTA detects particles.
It does not automatically identify every detected particle as an exosome.
A biological sample can potentially contain extracellular vesicles as well as other nanoscale particles or material capable of producing a detectable signal.
That's why a particle concentration measurement should be interpreted as one piece of EV characterization—not as complete proof of particle identity.
This connects directly to something we discussed in Exosomes vs. Extracellular Vesicles: What's the Difference?: size alone does not establish that a particle originated through the biological pathway that defines an exosome.
Why Particle Size Matters Too
Particle count becomes more informative when considered alongside particle-size distribution.
Rather than simply producing one number, techniques such as NTA can provide information about the range of particle sizes present in a sample.
For example, a laboratory report might provide measurements such as:
- mean particle diameter
- median particle diameter
- mode particle diameter
- particle-size distribution
- total particle concentration
This helps describe the physical characteristics of the measured particle population.
EV populations are heterogeneous, meaning the particles within a sample aren't necessarily all identical in size or composition. MISEV2023 therefore recommends reporting EV characteristics using complementary measurements rather than relying on a single measurement alone.
Why Different Measurement Methods Can Produce Different Results
Not every instrument detects extracellular vesicles in exactly the same way.
Researchers have compared methods including:
- nanoparticle tracking analysis
- flow cytometry
- transmission electron microscopy
- resistive pulse sensing
These techniques have different detection principles, sensitivities, and practical limitations.
In a comparative study, van der Pol and colleagues demonstrated that measured EV size distributions and concentrations can differ substantially depending on the measurement technique and its detection limits.
That means particle counts from two different laboratories or measurement systems aren't necessarily directly comparable without knowing how the measurements were obtained.
Even Instrument Settings Matter
There is another layer of complexity.
Even when two measurements use NTA, factors such as:
- sample concentration and dilution
- instrument settings
- detection thresholds
- measurement duration
- software settings
- operator technique
- sample preparation
can influence the resulting measurement.
Research examining NTA has shown that sample concentration needs to fall within an appropriate measurement range and that methodological choices can affect reported particle size and concentration.
This is why good laboratory documentation should identify the analytical method rather than simply presenting a large particle number without context.
A Real Example: How a HydroKarma Lot Was Measured
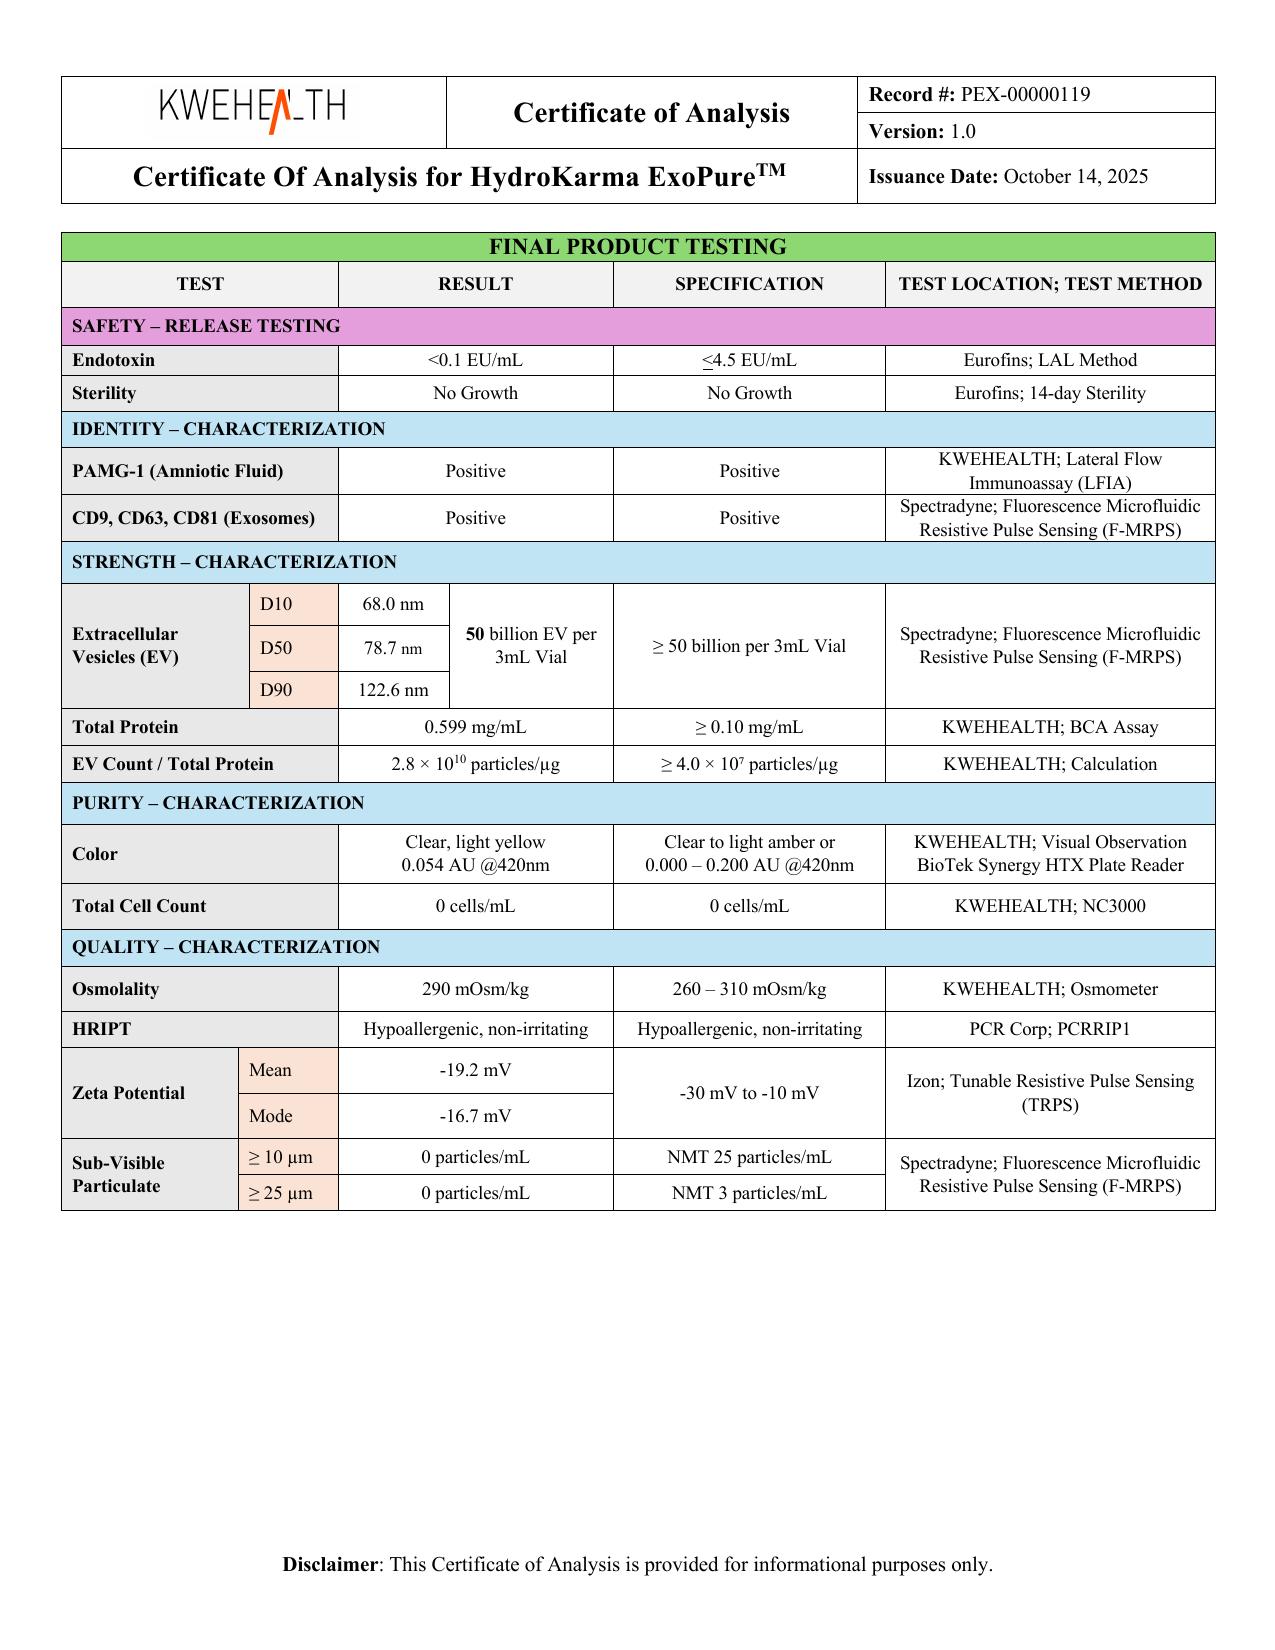
Different analytical technologies can be used to measure extracellular-vesicle preparations. Nanoparticle tracking analysis (NTA), for example, is commonly used in EV research, but it is not the method reported for the HydroKarma lot shown here.
According to KWEHEALTH's batch-specific Certificate of Analysis, extracellular-vesicle quantity and size distribution for this lot were measured using Fluorescence Microfluidic Resistive Pulse Sensing (F-MRPS).
The COA reports:
- EV quantity: 50 billion EV per 3 mL vial
- D10: 68.0 nm
- D50: 78.7 nm
- D90: 122.6 nm
- Test method: Spectradyne; Fluorescence Microfluidic Resistive Pulse Sensing (F-MRPS)
According to KWEHEALTH, HydroKarma's 50-billion designation means 50 billion exosomes per vial, in addition to other extracellular vesicles naturally present in the product.
KWEHEALTH/HydroKarma states that extracellular vesicles carrying at least one of the tetraspanins CD9, CD63 or CD81 are included in its reported exosome count. This is the manufacturer's stated counting basis and is not a universal scientific definition of an exosome.
What Do D10, D50 and D90 Mean?
These values help describe the particle-size distribution measured in the sample.
- D10 is the particle diameter below which 10% of the reported cumulative particle-size distribution falls.
- D50 is the median particle diameter: 50% of the reported distribution falls below this size and 50% falls above it.
- D90 is the particle diameter below which 90% of the reported distribution falls.
For this documented lot, the reported values were 68.0 nm at D10, 78.7 nm at D50 and 122.6 nm at D90.
These measurements provide more information than a particle-count number alone because they also describe the size distribution of the measured particle population.
How F-MRPS Fits Into Particle Measurement
Microfluidic resistive pulse sensing measures individual particles as they pass through a microscopic sensing region. A particle passing through the pore produces a measurable change in electrical resistance, allowing information about individual particles and their size distribution to be obtained.
The fluorescence-enabled method reported on KWEHEALTH's COA adds fluorescence-based detection to the microfluidic resistive-pulse approach.
As with other analytical technologies, the method used is important context when interpreting the reported particle concentration and size measurements. For a step-by-step walkthrough of these documents, see How to Read an Exosome Certificate of Analysis (COA).
Does a Higher Particle Count Mean a Better Product?
Not by itself.
Particle count tells you something important: how many detectable particles were measured.
It does not independently tell you:
- the identity of every particle
- the biological origin of every particle
- the purity of the preparation
- what biological molecules the particles contain
- how the material was produced
- how consistently different batches were manufactured
- what other material may be present
So comparing extracellular-vesicle preparations based solely on the largest particle number can be misleading.
A better evaluation considers particle count alongside characterization, manufacturing information, testing, and documentation.
As explained in How Are Exosomes Produced and Processed?, the cell source, culture conditions, separation methods, processing, and characterization all provide context for understanding the final preparation.
What About “Exosome Count”?
You'll frequently encounter the phrase exosome count in product descriptions and general conversation.
Scientifically, particle count or EV particle concentration may sometimes be the more precise description, depending on the analytical method used.
For example, if a particle-analysis instrument reports 40 billion detected particles, that measurement describes detected particles; confirming exosome identity requires additional characterization.
This doesn't make the measurement meaningless.
It simply means the number should be described according to what the analytical method actually measured.
That distinction is one reason understanding laboratory methodology matters.
How Should You Read a Particle Count on a COA?
When you encounter a particle count on a Certificate of Analysis (COA), don't stop at the biggest number on the page.
Look for context.
Useful questions include:
What analytical method was used?
Was the concentration measured using NTA, another particle-tracking technique, flow cytometry, or another method?
What units are being reported?
Is the result particles/mL, particles/vial, or total particles?
What is the sample volume?
This helps distinguish concentration from total particle count.
Is particle-size information provided?
Size distribution provides additional information about the measured population.
Are other characterization methods reported?
Particle count is more informative when interpreted alongside complementary testing.
We'll go through these documents step by step in How to Read an Exosome Certificate of Analysis (COA).
Particle Count Is One Piece of the Puzzle
A useful way to think about EV characterization is:
| Measurement | Question it answers |
|---|---|
| Particle count | How many detectable particles were measured? |
| Particle concentration | How many particles were measured within a particular volume? |
| Particle-size distribution | What range of particle sizes was detected? |
| Identity/characterization testing | What additional evidence helps describe what those particles are? |
| Purity-related measurements | What else may be present in the preparation? |
Together, these measurements provide much more information than particle count alone.
The Bottom Line
Large particle numbers are easy to understand and easy to compare, which makes them naturally attention-grabbing.
A larger particle count by itself is not a measure of product quality.
To interpret a particle count properly, you need to understand:
- what was measured
- how it was measured
- what volume the measurement represents
- the particle-size distribution
- what other characterization was performed
Particle count is useful data.
Context is what makes that data meaningful.
Original Source / References
- Welsh et al. — Minimal information for studies of extracellular vesicles (MISEV2023): From basic to advanced approaches. Journal of Extracellular Vesicles, 2024. DOI: 10.1002/jev2.12404 (PMID 38326288)
- Comfort et al. — Nanoparticle Tracking Analysis for the Quantification and Size Determination of Extracellular Vesicles. Journal of Visualized Experiments, 2021. DOI: 10.3791/62447 (PMID 33843938)
- van der Pol et al. — Particle size distribution of exosomes and microvesicles determined by transmission electron microscopy, flow cytometry, nanoparticle tracking analysis, and resistive pulse sensing. Journal of Thrombosis and Haemostasis, 2014. DOI: 10.1111/jth.12602 (PMID 24818656)
- Cimorelli M, Nieuwland R, Varga Z, van der Pol E. — Standardized procedure to measure the size distribution of extracellular vesicles together with other particles in biofluids with microfluidic resistive pulse sensing. PLOS ONE, 2021. DOI: 10.1371/journal.pone.0249603. This paper supports the general explanation of microfluidic resistive pulse sensing; it does not document or validate KWEHEALTH's specific product or testing program.
Continue Learning
How to Read an Exosome Certificate of Analysis (COA)
A plain-English walkthrough of an extracellular-vesicle Certificate of Analysis: lot numbers, analytical methods, particle concentration, particle size, characterization, specifications and results.
How Are Exosomes Produced and Processed?
Extracellular vesicles can come from cultured cells or directly from biological fluids. A plain-English look at cell-culture-derived EVs, biofluid-derived EVs, and HydroKarma's amniotic-fluid-derived pathway.
Exosomes vs. Extracellular Vesicles: What's the Difference?
Extracellular vesicle is the broader scientific term. An exosome is a specific type of extracellular vesicle defined by how it originates inside a cell.
Understanding Extracellular Vesicle Characterization and Testing
Characterization is how laboratories measure and describe different properties of an extracellular-vesicle preparation — particle count, particle size, EV-associated markers, total protein and zeta potential — and why no single test describes everything.