
Quality, Testing & COAs
Understanding Extracellular Vesicle Characterization and Testing
Characterization is how laboratories measure and describe different properties of an extracellular-vesicle preparation — particle count, particle size, EV-associated markers, total protein and zeta potential — and why no single test describes everything.
If you've looked at an extracellular-vesicle product or Certificate of Analysis, you've probably encountered words like characterization, particle count, particle size, CD9, CD63, CD81, total protein, or zeta potential.
To someone new to extracellular vesicles, that can look like a wall of laboratory terminology.
But the basic idea is much simpler:
Characterization is how researchers and laboratories measure and describe different properties of an extracellular-vesicle preparation.
There isn't one test that tells you everything about a sample. One measurement may tell you how many particles were detected. Another can describe their sizes. Another can look for proteins associated with extracellular vesicles.
The useful picture comes from putting those different pieces of information together.
What Does “Characterization” Mean?
Characterization means measuring and describing properties of a sample.
For an extracellular-vesicle (EV) preparation, researchers may want to know:
- How many particles were detected?
- What sizes are those particles?
- Are EV-associated proteins detectable?
- How much protein is present?
- Are other types of material present?
- What physical properties does the particle suspension have?
Different analytical methods answer different questions.
That's why modern EV research emphasizes complementary characterization rather than treating a single measurement as a complete description of an EV preparation.
If you're completely new to EV terminology, start with What Are Exosomes? A Beginner's Guide.
Why Isn't One Test Enough?
Imagine trying to describe a car using only its weight.
Knowing the weight tells you something useful—but it doesn't tell you its dimensions, engine type, appearance or what it's made from.
EV characterization works similarly.
A particle-count measurement tells you something different from a protein-marker test, and both tell you something different from a measurement of particle size.
For example:
| Question | Type of Measurement |
|---|---|
| How many particles were detected? | Particle concentration/count |
| What sizes were detected? | Particle-size analysis |
| Are certain EV-associated proteins detectable? | Marker analysis |
| How much protein is present? | Protein assay |
| What electrical properties does the suspension exhibit? | Zeta-potential measurement |
No single row answers all the others.
That is one reason the method used to obtain a result matters almost as much as the number itself.
Particle Count and Concentration
One of the most visible measurements on an EV report is usually particle count or concentration.
You may see numbers expressed as:
- particles/mL
- or as a total quantity associated with a vial.
As we explain in Understanding Exosome Concentration and Particle Count, these aren't necessarily the same thing.
A concentration tells you how many particles were measured within a particular volume.
A total count describes the reported number associated with the full volume being considered.
But there's another important question:
How were those particles measured?
Different Technologies Can Measure Particles Differently
Several analytical technologies can be used in EV research.
One commonly encountered technique is nanoparticle tracking analysis (NTA).
NTA observes nanoscale particles moving in liquid and uses their Brownian motion to estimate particle size. It can also be used to estimate particle concentration.
Another approach is microfluidic resistive pulse sensing (MRPS).
Instead of tracking scattered light from moving particles, resistive-pulse methods detect individual particles as they pass through a small sensing region.
When a particle passes through the sensing pore, it temporarily changes the electrical resistance across that region. Those events can be used to obtain information about individual particles, including their size, and to determine particle concentration.
Published work has demonstrated the use of MRPS for measuring particle concentration and size distributions in EV-containing biological fluids.
Different analytical technologies operate according to different physical principles and have different capabilities and limitations.
That's why two particle measurements shouldn't automatically be treated as directly interchangeable without knowing how each measurement was obtained.
A Real Example: KWEHEALTH/HydroKarma Characterization
Now we can look at these concepts in an actual product document.
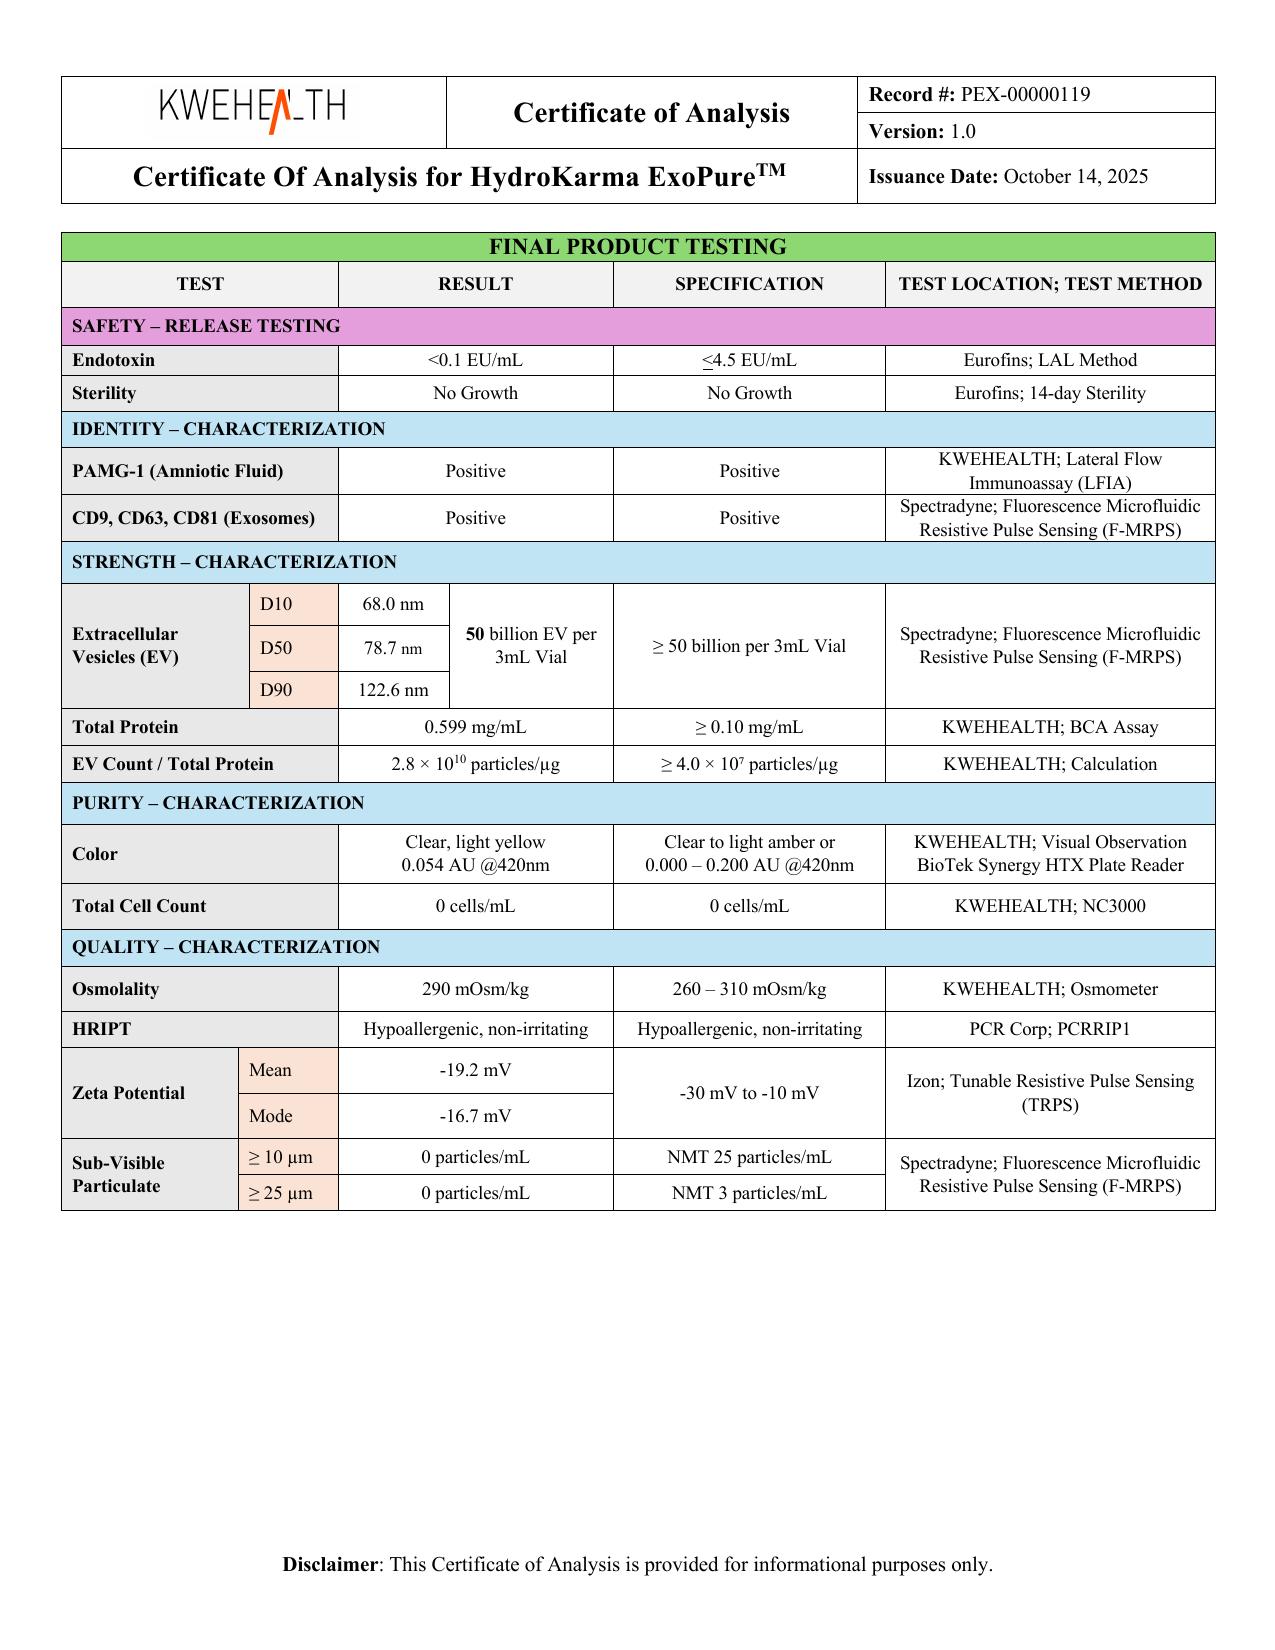
According to KWEHEALTH's batch-specific Certificate of Analysis for lot KH-0007DE, multiple measurements were reported as part of final-product testing.
This is useful because it demonstrates what we mean when we say characterization involves more than one number.
The COA reports:
| Characteristic | Result Reported on COA | Method Reported on COA |
|---|---|---|
| EV-associated markers | CD9, CD63, CD81: Positive | Spectradyne; Fluorescence Microfluidic Resistive Pulse Sensing (F-MRPS) |
| EV quantity | 50 billion EV per 3 mL vial | Spectradyne; F-MRPS |
| EV size distribution | D10: 68.0 nm; D50: 78.7 nm; D90: 122.6 nm | Spectradyne; F-MRPS |
| Total protein | 0.599 mg/mL | BCA assay |
| EV count / total protein | 2.8 × 10¹⁰ particles/µg | Calculation |
| Total cell count | 0 cells/mL | NC3000 |
| Zeta potential | Mean: −19.2 mV; Mode: −16.7 mV | Izon; Tunable Resistive Pulse Sensing (TRPS) |
These are lot-specific results reproduced from KWEHEALTH's supplied COA. They should not be interpreted as results reported by the independent scientific papers cited below or as universal specifications for every HydroKarma lot.
What Does F-MRPS Mean?
The KWEHEALTH COA identifies Fluorescence Microfluidic Resistive Pulse Sensing (F-MRPS) as the method used for several EV measurements.
The resistive-pulse portion of the technology allows individual particles passing through a microfluidic sensing region to be detected and sized.
The fluorescence-enabled approach adds fluorescence-based detection capabilities.
For someone reading the COA, the important takeaway isn't memorizing how the instrument works.
It's understanding that the reported 50-billion quantity and D10/D50/D90 measurements aren't arbitrary marketing numbers. The COA identifies the analytical method associated with those reported measurements. According to KWEHEALTH, HydroKarma's 50-billion designation means 50 billion exosomes per vial, in addition to other extracellular vesicles naturally present in the product.
That context matters when interpreting particle data.
Understanding D10, D50 and D90
The COA reports:
- D10: 68.0 nm
- D50: 78.7 nm
- D90: 122.6 nm
These numbers describe the reported particle-size distribution.
In simplified terms:
- D10 represents the diameter below which 10% of the reported cumulative particle-size distribution falls.
- D50 represents the median diameter.
- D90 represents the diameter below which 90% of the reported cumulative particle-size distribution falls.
So instead of merely saying “the particles are about 79 nanometers,” these measurements provide a better picture of how particle sizes are distributed across the measured population.
We discuss particle count and these size measurements in greater detail in Understanding Exosome Concentration and Particle Count.
CD9, CD63 and CD81
The same COA reports positive results for:
- CD9
- CD63
- CD81
These are proteins commonly associated with extracellular vesicles and frequently encountered in EV characterization literature.
This type of marker information adds another piece of evidence beyond simply measuring particle size and quantity.
KWEHEALTH/HydroKarma states that extracellular vesicles carrying at least one of the tetraspanins CD9, CD63 or CD81 are included in its reported exosome count. That is the manufacturer's stated counting basis for its own product, not a universal scientific definition of an exosome.
But there is an important distinction:
Marker detection establishes that EV-associated proteins were present in the tested material. It is one line of evidence, read alongside particle, size and protein measurements rather than on its own.
EV characterization works by considering multiple measurements together rather than asking one marker—or one instrument—to establish everything about a sample.
That distinction also helps explain why scientists use the broader term extracellular vesicle carefully. See Exosomes vs. Extracellular Vesicles: What's the Difference? for a deeper explanation.
Total Protein
KWEHEALTH's COA reports:
- Total Protein: 0.599 mg/mL
with BCA Assay listed as the method.
A BCA assay is a commonly used biochemical method for measuring protein concentration.
Protein measurement gives us another type of information about the preparation, but—as with particle count—it isn't intended to describe everything about the sample on its own.
EV Count / Total Protein
The COA also reports:
- 2.8 × 10¹⁰ particles/µg
for EV Count / Total Protein.
Why compare particles with protein?
Because looking at particle number relative to protein content can provide additional context about an EV preparation beyond particle count alone.
It is another example of combining measurements rather than relying on one headline number.
It should still be interpreted alongside the other characterization data and within the context of the analytical methods used.
Zeta Potential
Another measurement on the COA is zeta potential.
For lot KH-0007DE, KWEHEALTH reports:
- Mean: −19.2 mV
- Mode: −16.7 mV
with Tunable Resistive Pulse Sensing (TRPS) listed as the method.
Zeta potential can provide information relevant to the physical behavior of particles in suspension.
It answers a different question from particle count, particle size or protein-marker analysis—which is exactly why multiple measurements can be useful when describing a complex particle preparation.
Characterization Is Not the Same as Purification
This distinction is important.
Processing and purification describe what is done to separate and refine material.
Characterization describes properties of the resulting preparation.
So when we discuss the processing of amniotic-fluid-derived EVs in How Are Exosomes Produced and Processed?, we're discussing a different stage of the overall process.
Purification asks:
How was the material separated and refined?
Characterization asks:
What measurable properties does the resulting preparation have?
The two concepts are connected, but they aren't interchangeable.
Characterization Is Also Not the Same as Release Testing
The KWEHEALTH COA makes this distinction particularly easy to see because its Final Product Testing table separates several categories.
The document includes areas such as:
- Safety – Release Testing
- Identity – Characterization
- Strength – Characterization
- Purity – Characterization
- Quality – Characterization
The same document also reports measurements such as:
- Endotoxin: <0.1 EU/mL
- Sterility: No Growth
- Osmolality: 290 mOsm/kg
- Total Cell Count: 0 cells/mL
- Sub-visible particulate ≥10 µm: 0 particles/mL
- Sub-visible particulate ≥25 µm: 0 particles/mL
These results answer different questions.
A sterility test isn't measuring particle concentration.
An endotoxin test isn't determining EV size.
An osmolality measurement isn't identifying CD9, CD63 or CD81.
The broader quality picture comes from understanding what each test was designed to measure.
How Should You Evaluate an EV Characterization Report?
You don't need to be a laboratory scientist to ask useful questions.
When looking at EV testing information, start with six:
1. What was measured?
Particle quantity? Size? Protein? EV-associated markers? Something else?
2. What method was used?
Don't look only at the result. Look at how the laboratory obtained it.
3. What units are being reported?
Particles/mL, total particles, nanometers, mg/mL and particles/µg describe different things.
4. What does that particular measurement actually tell me?
A particle-count test and a protein assay answer different questions.
5. What doesn't that measurement tell me?
Avoid stretching one result beyond what the method was designed to establish.
6. Are complementary measurements provided?
Multiple appropriately selected measurements can provide a more informative description than one impressive-looking number.
For a step-by-step explanation of how this information appears on an actual document, see How to Read an Exosome Certificate of Analysis (COA).
More Tests Doesn't Automatically Mean Better Characterization
It's tempting to judge laboratory documentation by the number of tests listed.
More isn't automatically better.
The more useful questions are:
- Were appropriate measurements selected?
- Were the methods identified?
- Are the results reported clearly?
- Do the measurements provide complementary information?
- Can you understand what each test actually demonstrates?
A long list of unexplained results can be less useful than a smaller set of clearly documented, complementary measurements.
The goal isn't to accumulate laboratory terminology.
The goal is to understand the preparation being characterized.
Putting the Pieces Together
Using the KWEHEALTH COA as our real-world example:
- F-MRPS → provides reported EV particle quantity, size-distribution information and EV-associated marker results.
- BCA assay → provides total-protein concentration.
- Particle-to-protein calculation → relates the reported EV count to measured protein.
- TRPS → provides the reported zeta-potential measurement.
- Other final-product testing → provides additional information concerning characteristics such as sterility, endotoxin, osmolality, cell count and sub-visible particulates.
Each result answers a different question.
Together, they provide a much richer picture than simply saying:
“This vial contains 40 billion particles.”
The Bottom Line
Extracellular-vesicle characterization isn't one test, one marker or one particle-count number.
It's the process of using appropriate analytical measurements to describe different properties of an EV preparation.
Particle analysis can provide information about quantity and size.
Marker analysis can provide information about EV-associated proteins.
Protein assays provide another biochemical measurement.
Measurements such as zeta potential describe other physical properties of the particle suspension.
And quality/release tests answer still other questions about the manufactured lot.
The KWEHEALTH/HydroKarma COA provides a useful real-world example because it reports multiple measurements and identifies the methods associated with them.
Once you understand what each test measures—and what it doesn't—the rows and numbers on an EV characterization report become much easier to interpret.
Original Source / References
- Welsh et al. — Minimal information for studies of extracellular vesicles (MISEV2023): From basic to advanced approaches. Journal of Extracellular Vesicles, 2024. DOI: 10.1002/jev2.12404, PMID: 38326288. MISEV2023 provides current guidance concerning EV terminology, characterization and the use of complementary analytical approaches.
- Cimorelli et al. — Standardized procedure to measure the size distribution of extracellular vesicles together with other particles in biofluids with microfluidic resistive pulse sensing. PLOS ONE, 2021. DOI: 10.1371/journal.pone.0249603. This paper supports our general explanation of MRPS as an analytical approach. It does not document KWEHEALTH's specific testing program or HydroKarma products.
- van der Pol et al. — Particle size distribution of exosomes and microvesicles determined by transmission electron microscopy, flow cytometry, nanoparticle tracking analysis, and resistive pulse sensing. Journal of Thrombosis and Haemostasis, 2014. DOI: 10.1111/jth.12602, PMID: 24818656. This study is useful for understanding why particle measurements obtained using different analytical techniques shouldn't automatically be treated as interchangeable.
- KWEHEALTH/HydroKarma Certificate of Analysis — Lot KH-0007DE. The HydroKarma-specific test methods, measurements and results discussed in this article come from the manufacturer-supplied batch-specific COA. They are not attributed to the independent research papers above.
Continue Learning
What Does cGMP Mean? A Beginner's Guide to Manufacturing Quality
cGMP stands for Current Good Manufacturing Practice — a framework of manufacturing systems and quality controls, not a single test, cleanroom classification, or certificate.
How to Read an Exosome Certificate of Analysis (COA)
A plain-English walkthrough of an extracellular-vesicle Certificate of Analysis: lot numbers, analytical methods, particle concentration, particle size, characterization, specifications and results.