
Quality, Testing & COAs
What Is the Particle-to-Protein Ratio in Extracellular Vesicles?
A particle-to-protein ratio compares measured particles with measured protein. Here's how particles/µg is calculated, why it depends on the methods behind it, and why it isn't a purity percentage.
A Certificate of Analysis can contain measurements that are fairly easy to recognize:
- 50 billion particles
- 78.7 nm
- 0.599 mg/mL protein
Then you encounter something like:
2.8 × 10¹⁰ particles/µg
What exactly does that number mean?
This is a particle-to-protein ratio.
It combines two separate measurements—particle quantity and total protein—to describe how many measured particles are present relative to a measured amount of protein.
Particle-to-protein ratios have historically been used as one way to evaluate extracellular-vesicle preparations.
But the ratio needs careful interpretation.
It is not a universal purity score, and a higher number does not automatically prove that one EV product is better than another.
What Is a Particle-to-Protein Ratio?
The result is commonly expressed as:
particles per microgram of protein
or:
particles/µg
For example:
2.8 × 10¹⁰ particles/µg
means:
28 billion measured particles per microgram of measured protein.
The important word here is ratio.
This isn't a new measurement made independently of the particle and protein tests.
It is calculated using results obtained from those underlying measurements.
Why Compare Particles With Protein?
Extracellular-vesicle preparations contain proteins.
Some proteins may be associated with EV membranes or their contents, while biological samples may also contain soluble proteins, protein complexes and other non-vesicular material.
Researchers therefore became interested in whether the relationship between:
- measured particles
- and
- measured protein
could provide useful information about an EV preparation.
The basic reasoning is straightforward.
If a preparation contains a relatively large amount of protein but comparatively few particles, some of that protein may represent non-vesicular material.
If purification removes substantial amounts of non-vesicular protein while retaining particles, the particle-to-protein ratio may increase.
That idea led researchers to investigate the ratio as a potential purity-related metric.
Where Did This Idea Come From?
A frequently cited paper was published in 2013 by Jason Webber and Aled Clayton:
“How pure are your vesicles?”
The researchers proposed comparing nanoparticle counts with protein concentration as a straightforward way of estimating the purity of vesicle preparations.
In one experiment, they intentionally added particle-free bovine serum albumin to an EV preparation.
As the amount of added protein increased, particle counts changed little while the particle-to-protein ratio decreased.
This demonstrated an important concept:
Adding non-vesicular protein can lower the particle-to-protein ratio without changing particle quantity proportionally.
That made the ratio potentially useful as a practical indicator of how much protein accompanied the measured particles in the preparations they studied.
How Is the Ratio Calculated?
Conceptually, the calculation is simple:
Particle concentration ÷ protein concentration = particles per unit of protein
For example, imagine a preparation containing:
3 × 10¹⁰ particles/mL
and:
1 µg protein/mL
The ratio would be:
3 × 10¹⁰ particles/µg
The volume units cancel because both underlying measurements describe the same sample volume.
What remains is the number of measured particles relative to the measured amount of protein.
A Real HydroKarma Example
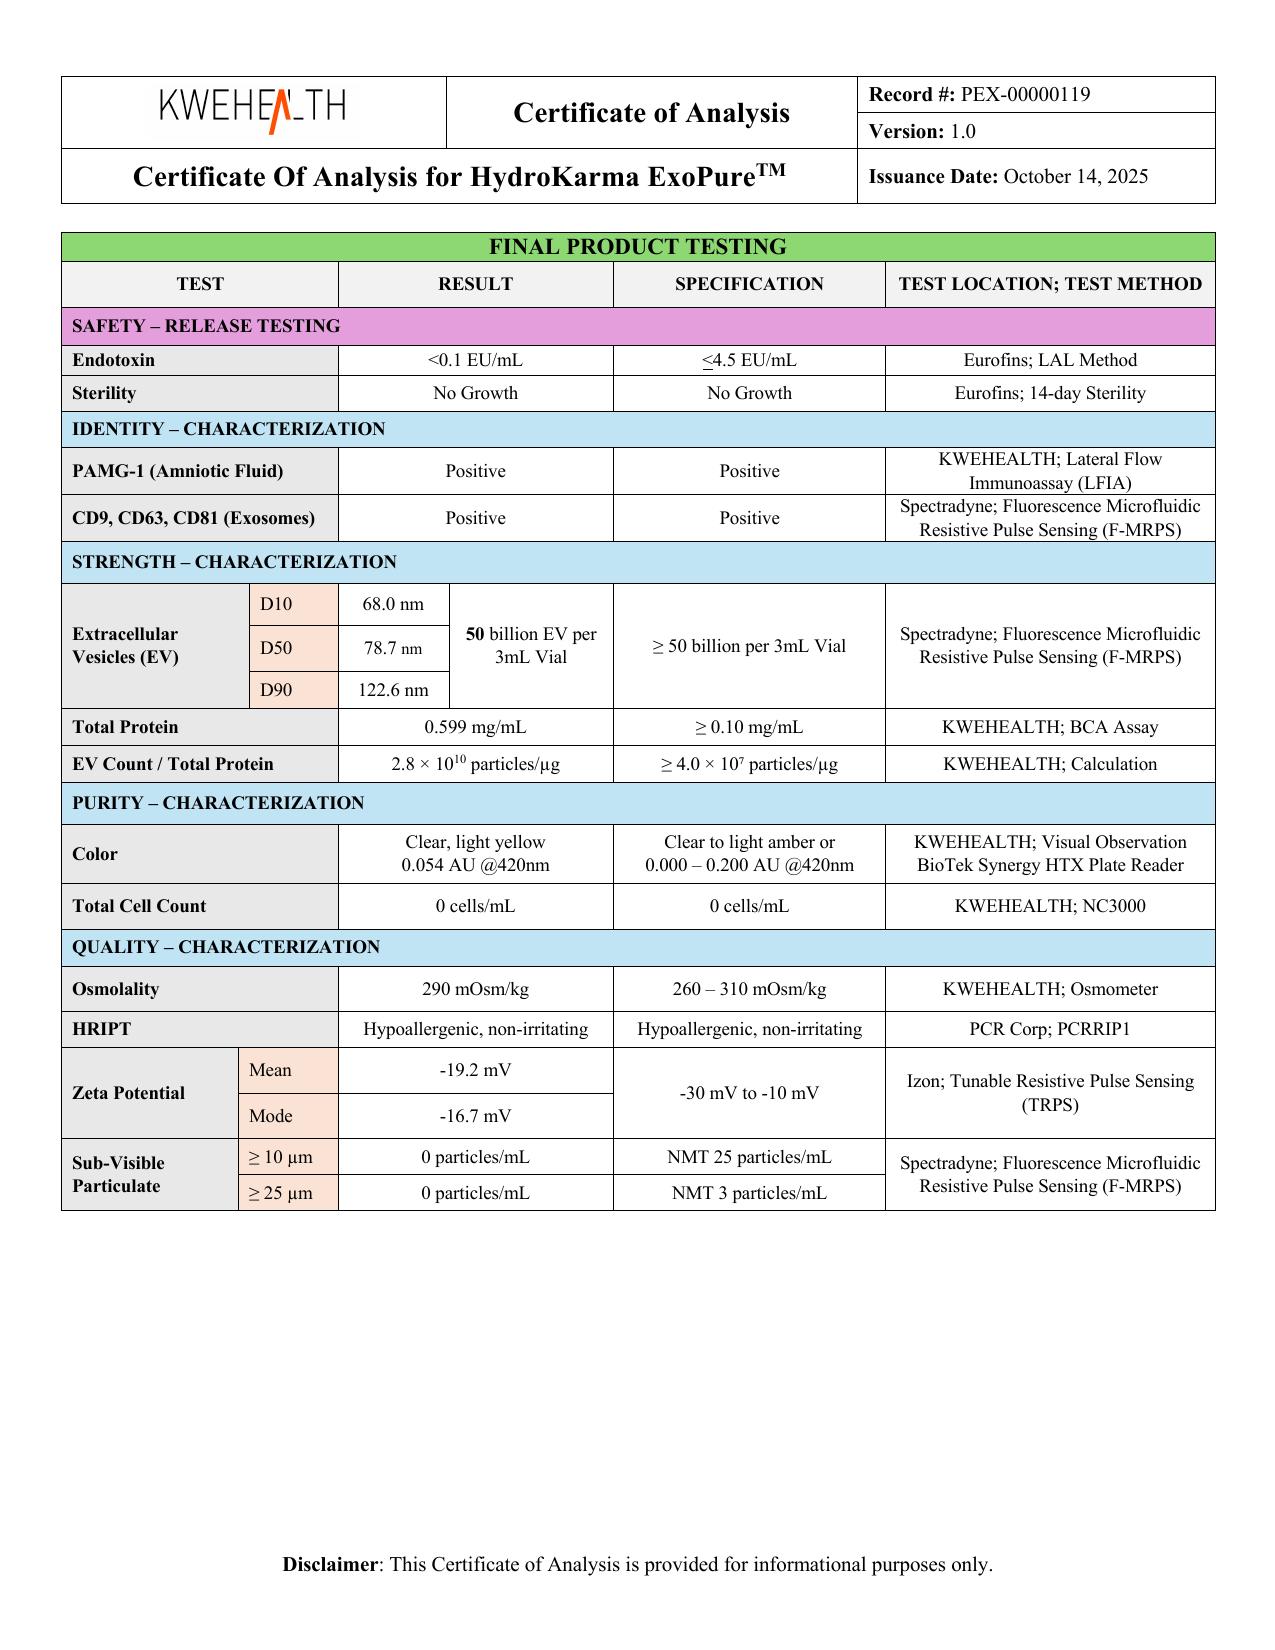
KWEHEALTH's batch-specific Certificate of Analysis for HydroKarma lot KH-0007DE reports:
EV Count / Total Protein: 2.8 × 10¹⁰ particles/µg
In ordinary numbers, that's:
28 billion particles per microgram of protein.
The same COA reports:
Total Protein: 0.599 mg/mL
using:
BCA
and separately reports:
EV quantity: 50 billion EV per 3 mL vial
with particle quantity/size associated with:
Spectradyne; Fluorescence Microfluidic Resistive Pulse Sensing (F-MRPS).
These are manufacturer-reported, lot-specific results.
The ratio should therefore be understood in the context of the underlying measurements and methods used for this particular lot.
Does 2.8 × 10¹⁰ Mean 28 Billion EVs Are Attached to One Microgram of Protein?
No.
That's not what the ratio means.
It doesn't describe a physical package containing one microgram of protein with exactly 28 billion EVs attached to it.
It is a mathematical relationship between:
- measured particle quantity
- and
- measured total protein.
This distinction matters because total protein is a bulk measurement of the preparation.
As explained in What Is Extracellular Vesicle Protein Content and Why Is It Measured?, the BCA assay doesn't independently determine whether every measured protein molecule is inside an EV, on an EV surface or outside an EV.
Does a Higher Ratio Mean a Purer EV Preparation?
This is where things get more complicated.
In their 2013 study, Webber and Clayton proposed numerical ranges for interpreting particle-to-protein ratios within the context of the preparations and measurement approaches they studied. They described ratios approaching 3 × 10¹⁰ particles/µg as highly pure and much lower ratios as containing substantially more protein relative to particles.
That historical finding is useful.
But it should not be turned into a universal modern grading scale for every EV preparation.
Why?
Because the ratio depends entirely on the two measurements used to calculate it.
Change the particle measurement, and the numerator can change.
Change the protein measurement, and the denominator can change.
That means the ratio can change even if you're examining the same underlying biological preparation.
Why Measurement Methods Matter
Consider the numerator:
particle count
Different particle-analysis technologies have different detection principles, sensitivities and size ranges.
HydroKarma's KH-0007DE COA reports F-MRPS for particle quantity and size.
Webber and Clayton's original work used a NanoSight system for nanoparticle measurement.
Those are not the same analytical method.
Now consider the denominator:
total protein
Protein assays also have their own analytical characteristics and potential interferences.
KH-0007DE reports a BCA assay for total protein.
Therefore, directly taking a purity threshold derived from one experimental system and applying it to a ratio produced using a different particle-measurement technology can create a misleading sense of precision.
Why Modern Guidance Is More Cautious
As extracellular-vesicle science has matured, characterization standards have become more nuanced.
MISEV2023 emphasizes that EV preparations should be characterized using multiple complementary measurements rather than relying on one ratio or marker.
When particle-to-protein relationships are reported, the underlying particle and protein measurements are important because the resulting ratio depends on how those measurements were obtained.
That gives us a better way to think about the metric:
Particle-to-protein ratio can contribute information about an EV preparation, but it shouldn't replace the underlying data or broader characterization.
Is 2.8 × 10¹⁰ a Good Result?
We can accurately say:
KWEHEALTH reports an EV count/total protein value of 2.8 × 10¹⁰ particles/µg for lot KH-0007DE.
We can also explain that historically, particle-to-protein ratios have been investigated as purity-related metrics.
What we should not say from this number alone is:
“HydroKarma is 93% pure.”
or:
“HydroKarma is scientifically proven to be high purity because its result is close to 3 × 10¹⁰.”
or:
“HydroKarma is purer than Product X because its ratio is higher.”
Those conclusions would go beyond what the measurement establishes.
The scientifically responsible interpretation is:
The ratio is one characterization metric that should be considered alongside the methods used and the rest of the lot's analytical results.
Why Total Protein Isn't Simply “Contamination”
There's another reason to be careful.
Extracellular vesicles themselves contain proteins.
Therefore:
protein ≠ contamination
The purpose of the particle-to-protein ratio isn't to pretend that an ideal EV preparation contains particles and zero protein.
Rather, the metric attempts to provide information about the relationship between the particle population and the total amount of measured protein.
That relationship can be influenced by both EV-associated and non-vesicular material.
This is one reason extracellular-vesicle purity can't be reduced to one calculation.
What Can Change a Particle-to-Protein Ratio?
A ratio can change if either side of the equation changes.
Factors may include:
- particle-measurement method
- particle detection limits
- protein-assay method
- sample preparation
- isolation or purification approach
- non-vesicular protein content
- co-isolated particles
- EV source material
- concentration procedures
For example, removing substantial soluble protein while retaining most measured particles could increase the ratio.
But losing particles during additional purification could change it differently.
This is why extracellular-vesicle isolation and purification involves tradeoffs between recovery, enrichment and removal of non-vesicular material.
Can You Compare Ratios Between Different Products?
Only with considerable caution.
Imagine:
| Product | Reported Particle-to-Protein Ratio |
|---|---|
| Product A (hypothetical example) | 3.0 × 10¹⁰ particles/µg |
| Product B (hypothetical example) | 2.0 × 10¹⁰ particles/µg |
Product A and Product B are hypothetical educational examples used only to illustrate how ratios can be misread. They are not real products, brands or competitors.
It would be easy to say:
Product A is 50% purer.
But the table alone doesn't establish that.
You would first need to understand whether both products used comparable:
- particle-counting methods
- detection ranges
- protein assays
- sample preparation
- calculation procedures
- reporting conventions
Without comparable methodology, a direct numerical ranking may be misleading.
A ratio is only as interpretable as the measurements behind it.
Particle-to-Protein Ratio Is Not EV Identity
Another limitation is that the numerator is based on measured particles.
Detecting a particle doesn't automatically establish that the particle is an extracellular vesicle.
And even if a preparation contains EVs, a particle count alone doesn't prove that every detected particle is an exosome.
That's why other characterization measurements matter.
For KH-0007DE, KWEHEALTH also reports:
- CD9: Positive
- CD63: Positive
- CD81: Positive
Those marker measurements provide a different kind of information from the particle-to-protein ratio.
See What Are CD9, CD63 and CD81? for more on what marker positivity does—and doesn't—tell us.
What Other Measurements Should Be Considered?
A particle-to-protein ratio becomes much more meaningful when viewed alongside the broader characterization profile.
For KH-0007DE, KWEHEALTH reports measurements including:
- EV quantity
- particle-size distribution
- CD9/CD63/CD81
- total protein
- EV count/total protein
- total cell count
- zeta potential
- sterility and other finished-product testing
Each answers a different question.
The ratio doesn't replace any of them.
Our guide Understanding Extracellular Vesicle Characterization and Testing explains how these measurements fit together.
How Should You Read Particles/µg on a COA?
When you see a particle-to-protein ratio, ask five questions.
1. What particle count was used?
Look for the underlying particle measurement.
2. What protein measurement was used?
Look for the protein concentration and assay.
3. What analytical methods produced those numbers?
The methods matter when interpreting or comparing ratios.
4. Is the ratio being treated as supporting information or a universal purity grade?
Be cautious about simplistic purity labels.
5. What other characterization data are available?
A ratio is more useful when interpreted as part of a broader analytical profile.
That's one reason How to Read an Exosome Certificate of Analysis (COA) emphasizes reading the entire document rather than selecting one impressive-looking number.
The Bigger Picture
Particle-to-protein ratio is a useful example of how extracellular-vesicle characterization has evolved.
An elegant idea was proposed:
Compare particle quantity with protein quantity.
Researchers demonstrated that adding non-vesicular protein could lower the ratio, giving the measurement potential as a practical purity-related metric.
But as analytical technology and EV standards developed, it became increasingly important to recognize that:
- particle counts are method-dependent
- protein measurements are method-dependent
and therefore:
the ratio is method-dependent too.
That doesn't make the metric useless.
It tells us how to use it responsibly.
The Bottom Line
A particle-to-protein ratio compares the measured number of particles with the measured amount of total protein in an EV preparation.
For HydroKarma lot KH-0007DE, KWEHEALTH reports:
2.8 × 10¹⁰ particles/µg
or:
28 billion particles per microgram of measured protein.
Historically, researchers including Webber and Clayton investigated particle-to-protein ratios as a practical way of estimating EV-preparation purity.
But the number shouldn't be treated as a universal purity score.
Its interpretation depends on:
- how particles were measured
- how protein was measured
- the characteristics of the preparation
- the broader characterization data
So when you encounter:
2.8 × 10¹⁰ particles/µg
don't ask only:
“Is that number high?”
A better question is:
“How were the particles and protein measured, and what does the rest of the characterization tell us?”
That's what turns a number on a COA into useful information.
Original Source / References
- Webber & Clayton — How pure are your vesicles? Journal of Extracellular Vesicles, 2013. DOI: 10.3402/jev.v2i0.19861, PMID: 24009896. This study proposed the particle-to-protein ratio as a practical purity-related measurement and experimentally examined how added non-vesicular protein affected the ratio.
- Welsh et al. — Minimal information for studies of extracellular vesicles (MISEV2023): From basic to advanced approaches. Journal of Extracellular Vesicles, 2024. DOI: 10.1002/jev2.12404, PMID: 38326288.
- KWEHEALTH/HydroKarma batch-specific Certificate of Analysis — Lot KH-0007DE. The 2.8 × 10¹⁰ particles/µg result, BCA protein result, F-MRPS particle measurement and other HydroKarma-specific values discussed above come from manufacturer-supplied batch documentation, not the independent papers above.
Continue Learning
What Is Extracellular Vesicle Yield and Recovery?
Yield describes how much extracellular-vesicle material is obtained. Recovery describes how much of a defined starting measurement is retained after processing. They are related, but not the same thing.
What Is Extracellular Vesicle Protein Content and Why Is It Measured?
Total protein tells you how much protein was measured in a preparation — not how many extracellular vesicles are present. Here's what protein results and particles/µg ratios do and don't mean.
What Is Extracellular Vesicle Purity? How EV Purity Is Evaluated
Extracellular vesicle purity is a multidimensional characterization question, not a single number on a Certificate of Analysis. Here's how particle counts, protein measurements, markers and particle-to-protein ratios each contribute — and what none of them establish alone.
How to Read an Exosome Certificate of Analysis (COA)
A plain-English walkthrough of an extracellular-vesicle Certificate of Analysis: lot numbers, analytical methods, particle concentration, particle size, characterization, specifications and results.