
Quality, Testing & COAs
How Are Extracellular Vesicle Particle Counts Measured?
A Certificate of Analysis can report billions of particles — but how does a laboratory arrive at that number? A plain-English guide to RPS, MRPS, NTA, flow cytometry and why the method behind a particle count matters.
A Certificate of Analysis may report a number such as:
50 billion EV per 3 mL vial
But how does a laboratory arrive at a number like that?
Extracellular vesicles are far too small to count with the naked eye or an ordinary microscope. Instead, laboratories use specialized analytical instruments that detect individual particles—or signals produced by particles—and use those measurements to estimate particle concentration, size distribution or total quantity.
Different technologies accomplish this in different ways.
Some track how particles move through a liquid.
Some detect changes in electrical resistance as particles pass through a microscopic sensing region.
Others use light scattering, fluorescence or flow-based detection.
That means a particle count should never be interpreted without asking another question:
How was it measured?
What Is Particle Counting?
A result may be reported as:
particles/mL
or as a total quantity associated with a defined sample or vial.
As discussed in What Is Extracellular Vesicle Concentration vs. Total Particle Count?, those two forms of reporting are related but aren't identical.
Why Are EV Particle Counts Difficult to Measure?
Extracellular-vesicle preparations present several analytical challenges.
EVs can:
- span a broad range of sizes
- overlap in size with non-vesicular particles
- occur at very high concentrations
- have different optical properties
- exist alongside proteins and other biological material
No particle-counting instrument simply looks at a sample and recognizes every object as:
“This is an exosome.”
Instead, instruments detect particular physical or optical characteristics.
That distinction is fundamental.
MISEV2023 recommends approximating EV abundance but cautions that particle-number concentration can be unreliable when techniques lack specificity for EVs or sensitivity across the full EV population.
Particle Count Is Not Automatically EV Count
Suppose an instrument detects:
10 billion particles/mL
That does not automatically establish:
10 billion confirmed extracellular vesicles/mL
And it certainly doesn't automatically establish:
10 billion confirmed exosomes/mL.
The instrument may be very good at detecting particles within its measurement capabilities.
But:
Key distinction
particle detection ≠ biological identity
This is why EV characterization uses complementary measurements.
Particle quantity can be considered alongside:
- particle size
- EV-associated markers
- protein measurements
- morphology
- assessment of non-vesicular material
- other characterization methods
Our guide Understanding Extracellular Vesicle Characterization and Testing explains how those measurements fit together.
What Does MISEV2023 Recommend?
MISEV2023 recommends that EV preparations include approximations of EV abundance, which may involve particle number, protein and/or lipid measurements.
For particle-number concentration specifically, it recommends paying attention to the analytical method's limit of detection, using dilution series where possible to demonstrate measurements are within an appropriate measurement region, and using complementary or orthogonal methods when practical.
Another important recommendation concerns terminology.
When a technique cannot sufficiently distinguish EVs from other co-isolated particles, MISEV2023 recommends reporting the result as pertaining to particles or extracellular particles, rather than automatically calling every detected object an EV.
That's an important principle for reading any EV particle-count result.
What Is Resistive Pulse Sensing?
The basic idea is surprisingly intuitive.
Imagine electrical current flowing through a tiny opening filled with conductive liquid.
When a particle passes through that opening, it temporarily displaces some of the conductive liquid.
That changes the electrical resistance.
The instrument detects that change as a pulse.
Individual particle events can therefore be detected electronically.
What Is Microfluidic Resistive Pulse Sensing?
Research describing the Spectradyne nCS1 MRPS system explains that samples travel through a microfluidic cartridge containing an electrical sensing region.
As a particle passes through a nanoconstriction, electrical resistance changes.
The resulting signal provides information about the particle.
The change in electrical resistance is related to the volume displaced by the particle, allowing the system to estimate particle size.
Meanwhile, particle-event counts combined with the measured sample flow can be used to derive particle-number concentration.
In simplified form:
MRPS in plain English
particle passes sensing region → electrical resistance changes → pulse detected → particle event counted
Repeated across many particles, these measurements can generate information about:
particle quantity
and:
particle-size distribution
A Real HydroKarma Example
KWEHEALTH's batch-specific Certificate of Analysis for HydroKarma lot KH-0007DE reports:
EV Quantity: 50 billion EV per 3 mL vial
The COA identifies the test method as:
Spectradyne; Fluorescence Microfluidic Resistive Pulse Sensing (F-MRPS)
and reports the particle-size distribution:
- D10: 68.0 nm
- D50: 78.7 nm
- D90: 122.6 nm
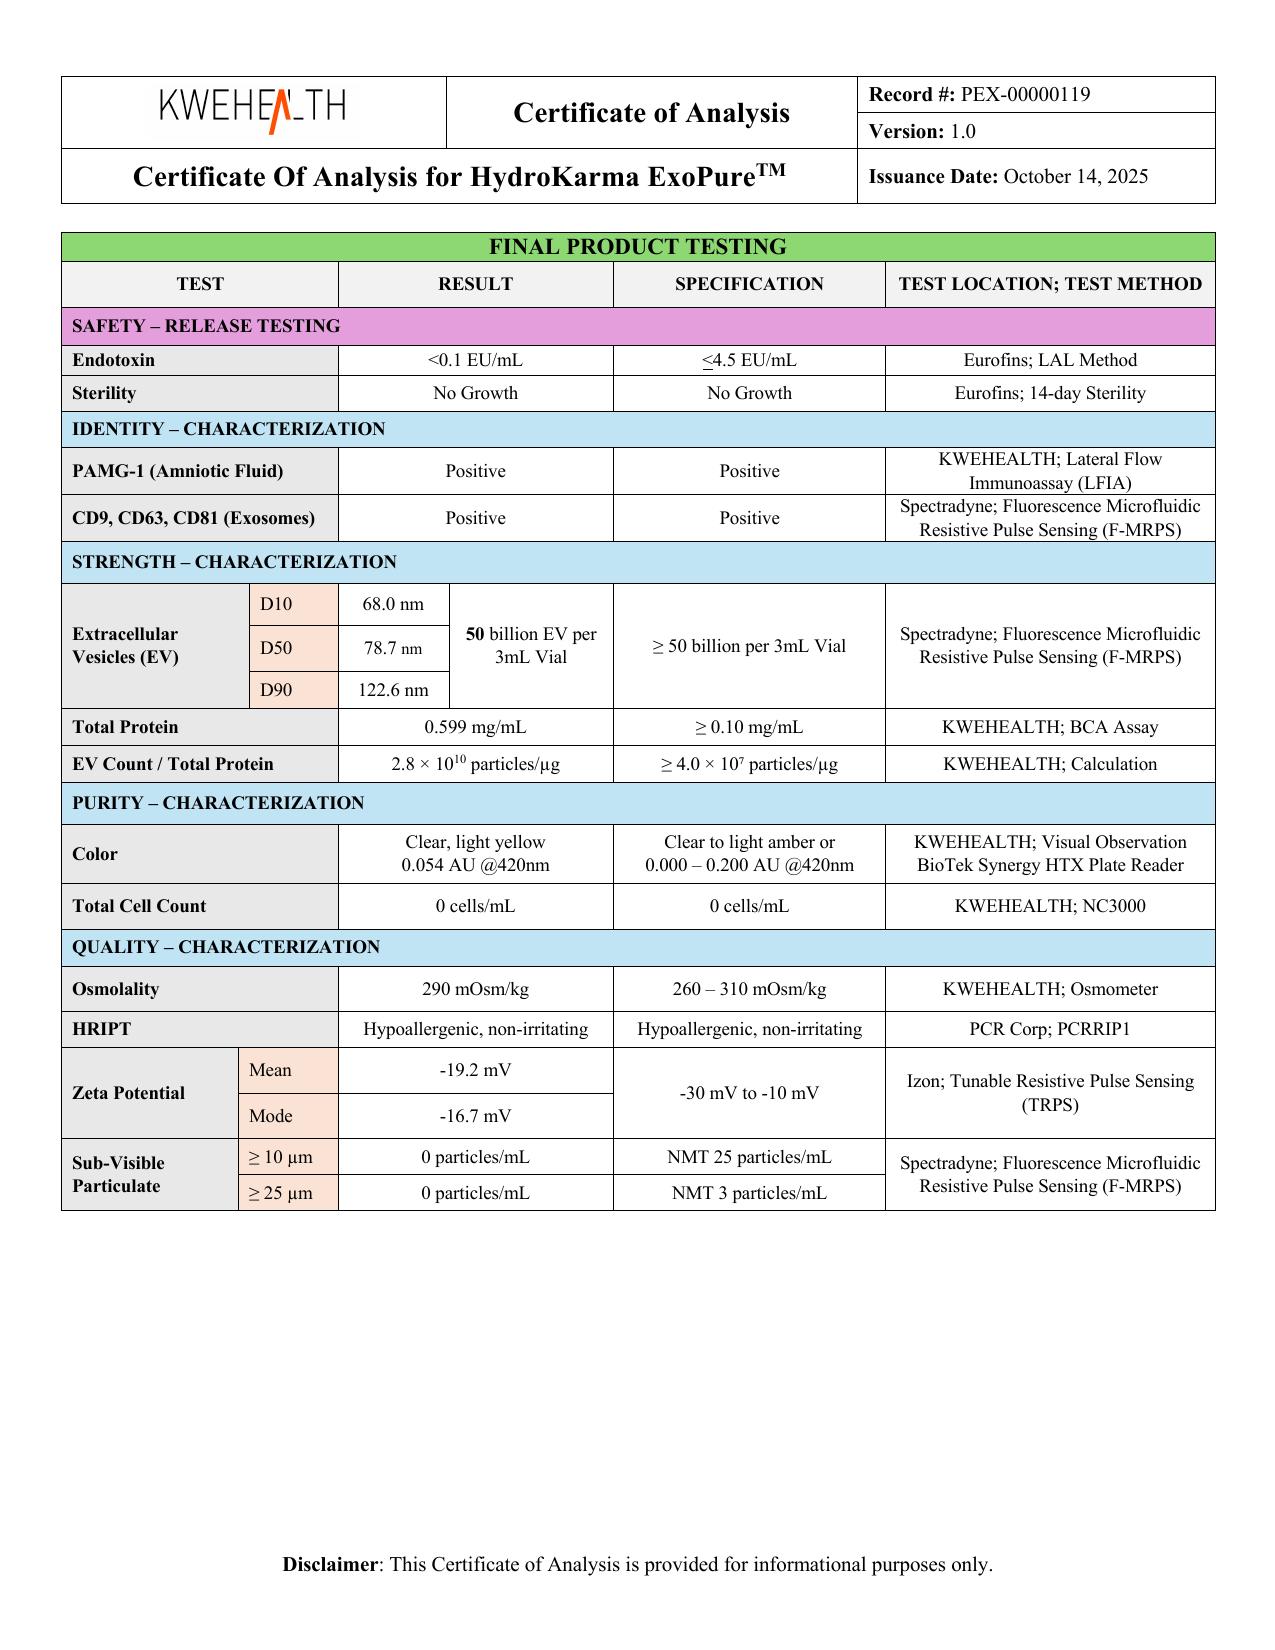
These are KWEHEALTH-reported, lot-specific results.
According to KWEHEALTH, HydroKarma's 50-billion designation means 50 billion exosomes per vial, in addition to other extracellular vesicles naturally present in the product.
KWEHEALTH/HydroKarma states that extracellular vesicles carrying at least one of the tetraspanins CD9, CD63 or CD81 are included in its reported exosome count. That is the manufacturer's stated counting basis, not a universal scientific definition of an exosome.
The COA therefore gives us something extremely useful when interpreting the particle quantity:
the analytical method associated with the reported measurement.
It doesn't simply provide a large number without identifying how the particles were analyzed.
What Does the “F” in F-MRPS Mean?
The COA specifically reports:
Fluorescence Microfluidic Resistive Pulse Sensing (F-MRPS).
Fluorescence-enabled approaches can add optical information to resistive-pulse measurements when particles or associated targets are appropriately fluorescently labeled.
However, we should be careful not to infer details that aren't disclosed in the COA.
The document identifies F-MRPS as the test method, but that alone doesn't tell us every proprietary analytical parameter used by the testing laboratory.
Therefore, we should not invent:
- fluorescent labels
- antibodies
- staining protocols
- gating strategies
- cartridge specifications
- detection thresholds
- dilution factors
- instrument settings
unless KWEHEALTH or the testing documentation provides them.
The scientifically appropriate statement is simply:
What we can say
F-MRPS is the particle quantity/size method reported on the KWEHEALTH COA for lot KH-0007DE.
What Can F-MRPS Establish on Its Own?
It measures particle size distribution and particle-number concentration.
Biological identity is a separate question.
Published research on MRPS notes that the technique can measure particle-size distributions and particle-number concentration, but MRPS by itself does not necessarily distinguish extracellular vesicles from all other particles in a biological preparation.
Therefore:
Key distinction
F-MRPS particle detection ≠ automatic proof of exosome identity
The particle measurement should be interpreted alongside other characterization information.
For KH-0007DE, KWEHEALTH also reports:
- CD9: Positive
- CD63: Positive
- CD81: Positive
Those results provide different information from the particle-count measurement.
See What Are CD9, CD63 and CD81? for why marker testing and particle counting answer different questions.
What Is Nanoparticle Tracking Analysis?
Another commonly used particle-analysis method in EV research is:
nanoparticle tracking analysis, or NTA.
In simplified terms:
NTA in plain English
particles scatter light → camera records particle movement → software tracks movement → particle size and concentration are estimated
NTA has become widely used in EV research.
But its measurements depend on factors such as:
- instrument configuration
- camera settings
- detection threshold
- sample concentration
- particle refractive properties
- dilution
- operator and analysis settings
That means NTA isn't simply an absolute particle counter independent of experimental conditions.
Does HydroKarma Use NTA for the COA Result?
Not according to the KH-0007DE COA we've been discussing.
The reported method is:
Spectradyne; F-MRPS
not NTA.
NTA is included here because it is an important general EV particle-analysis technique.
It should not be presented as HydroKarma's reported method.
That distinction also matters when comparing particle counts between products or studies.
Why Can Different Methods Produce Different Particle Counts?
Imagine measuring the same preparation with two instruments.
Instrument A detects particles beginning around one size range.
Instrument B can detect smaller particles.
Instrument B may therefore count particles that Instrument A never sees.
The reported concentrations can differ even though the underlying sample is the same.
Other differences may involve:
- detection physics
- sensitivity
- particle size range
- sample dilution
- optical properties
- signal thresholds
- data-processing methods
MISEV2023 therefore emphasizes the importance of understanding the limit of detection and analytical characteristics of particle-number measurements.
What Is a Limit of Detection?
For particle analysis, this can involve both:
particle size
and:
particle concentration.
An instrument may not reliably detect particles below a certain effective size.
It may also struggle when the sample contains too few—or too many—particles.
This matters because:
particles outside the instrument's effective measurement range may not contribute to the reported count in the same way as particles within it.
So every particle-count result exists within the capabilities of the method used to generate it.
Why Does Dilution Matter?
Particle concentration can also affect measurement quality.
A sample that is too concentrated may produce overlapping particle events or other measurement problems.
A sample that is too dilute may produce too few events for reliable analysis.
Researchers therefore often measure dilution series to identify an appropriate measurement range.
MISEV2023 recommends reporting dilution-series information where possible to demonstrate that concentration estimates fall within the linear region of the measurement system.
MRPS research has likewise shown the importance of appropriate sample dilution and cartridge measurement ranges when determining particle-size distributions and concentration.
Why Are Calibration and Reference Materials Important?
A particle-counting instrument needs a way to relate its signals to meaningful physical measurements.
Researchers may use reference particles or other calibration approaches to evaluate instrument performance.
For example, published MRPS studies have used particles of known characteristics during measurement procedures.
Reference materials can help researchers understand:
- detection performance
- sizing accuracy
- concentration measurement
- instrument consistency
- differences between analytical platforms
But reference particles aren't necessarily biologically identical to EVs.
Calibration helps characterize the measurement system; it doesn't turn a synthetic reference particle into an extracellular vesicle.
What About Flow Cytometry?
Flow cytometry can also be used for EV analysis.
In flow cytometry, particles pass individually through an interrogation region where optical signals such as light scattering and fluorescence can be measured.
Specialized approaches can characterize individual EVs and may provide information about:
- particle-associated markers
- fluorescence
- size-related properties
- concentration within defined measurement ranges
However, EVs present significant challenges because many are near or below the detection capabilities of conventional flow cytometers.
MISEV2023 therefore provides specific reporting recommendations for single-EV flow cytometry and emphasizes calibration and appropriate characterization.
What About Dynamic Light Scattering?
Dynamic light scattering, or DLS, is another technique used to characterize nanoscale particles.
DLS analyzes fluctuations in scattered light caused by particles moving in suspension.
It can provide information about particle size distributions.
But DLS isn't equivalent to counting individual particles one by one in the same way as some single-particle approaches.
For heterogeneous EV preparations, larger particles can also disproportionately influence light-scattering signals.
That's why different technologies shouldn't be treated as interchangeable simply because they all produce information about nanoscale particles.
Particle Counting vs. Particle Identification
This may be the most important distinction in the entire article.
Consider these two questions:
How many detectable particles are present?
and:
What are those particles biologically?
Those are different questions.
Particle-counting methods primarily help answer the first.
Characterization approaches involving markers and other measurements help build evidence for the second.
That's why:
Key distinctions
particle count ≠ EV identity — and EV identity ≠ exosome biogenesis
The term exosome refers to a specific biogenesis pathway, which cannot generally be established from particle size or particle count alone.
See Exosomes vs. Extracellular Vesicles: What's the Difference? for the terminology distinction.
Why Orthogonal Measurements Matter
For example, an EV preparation might be evaluated using:
particle counting
plus:
protein markers
plus:
another physical characterization technique.
These measurements don't simply repeat the same test.
They answer different questions.
MISEV2023 recommends orthogonal particle-number measurements where possible and broader complementary characterization of EV preparations.
This reduces the temptation to treat any single instrument result as the complete description of an EV preparation.
Can You Compare Particle Counts Between Two Products?
You can compare the reported numbers.
But interpreting that comparison requires context.
Suppose:
| Product | Reported Particle Quantity |
|---|---|
| Product A | 40 billion |
| Product B | 100 billion |
Hypothetical examples only
Product A and Product B are simplified educational illustrations. They do not represent real products, real HydroKarma lots, or competing products.
It would be tempting to conclude:
Product B contains twice as many equivalent EVs.
But before making that conclusion, you would want to know:
- What volume does each number describe?
- Were the same analytical methods used?
- What particle-size ranges were detectable?
- Were the samples prepared similarly?
- Are the numbers measured or calculated?
- Do the methods distinguish EVs from other particles?
- What complementary characterization was performed?
Without that information, the larger number alone doesn't establish a superior product.
How Should You Read a Particle Count on a COA?
When a COA reports particle quantity, ask:
1. What exactly is being reported?
Particles/mL? Particles/vial? Total particles?
2. What method was used?
NTA? MRPS? Another technique?
3. What volume does the result describe?
Concentration and total quantity are different.
4. What size range can the method detect?
Detection capabilities influence the result.
5. Was the result directly measured or calculated?
Know the origin of the number.
6. Does the method establish EV identity?
Don't automatically equate particles with confirmed exosomes.
7. What complementary characterization is provided?
Particle count is only one part of the analytical picture.
Our guide How to Read an Exosome Certificate of Analysis (COA) walks through this broader approach.
The Bigger Picture
Particle counting is essential to extracellular-vesicle research because scientists need quantitative ways to describe nanoscale preparations.
But there is no magic instrument that simply reports the absolute number of biologically confirmed exosomes in every sample.
Every measurement has:
a physical detection principle
a measurement range
analytical assumptions
sample-preparation requirements
and:
limitations.
Understanding those factors doesn't make particle counts less useful.
It makes them more useful, because the number can be interpreted in the context of how it was produced.
The Bottom Line
Extracellular-vesicle particle counts are generated using specialized analytical technologies that detect nanoscale particles through physical or optical signals.
Methods include:
- resistive pulse sensing
- microfluidic resistive pulse sensing
- nanoparticle tracking analysis
- specialized flow cytometry
- other particle-characterization technologies
For HydroKarma lot KH-0007DE, KWEHEALTH reports:
50 billion EV per 3 mL vial
and identifies the particle quantity/size method as:
Spectradyne; Fluorescence Microfluidic Resistive Pulse Sensing (F-MRPS).
The same COA reports:
- D10: 68.0 nm
- D50: 78.7 nm
- D90: 122.6 nm
Those results tell us how KWEHEALTH characterizes that specific lot.
But particle counting alone does not establish the biological identity of every detected particle.
The better question isn't simply:
“How many particles are there?”
It's:
The better question
“How were they measured, what can that method detect, and what other characterization supports the interpretation?”
Original Source / References
- Welsh et al. — Minimal information for studies of extracellular vesicles (MISEV2023): From basic to advanced approaches. Journal of Extracellular Vesicles, 2024. DOI: 10.1002/jev2.12404, PMID: 38326288. MISEV2023 provides current guidance on particle-number concentration, limits of detection, dilution series, orthogonal measurements and appropriate terminology for particle measurements.
- Cimorelli et al. — Standardized procedure to measure the size distribution of extracellular vesicles together with other particles in biofluids with microfluidic resistive pulse sensing. PLOS ONE, 2021. DOI: 10.1371/journal.pone.0249603, PMID: 33793681. This paper describes the operating principle and analytical considerations of MRPS for measuring particle-size distributions and particle-number concentrations in EV-containing samples.
- KWEHEALTH/HydroKarma batch-specific Certificate of Analysis — Lot KH-0007DE. The HydroKarma-specific 50 billion EV per 3 mL vial, F-MRPS method and D10/D50/D90 values come from manufacturer-supplied batch documentation and should not be attributed to the independent papers above.
Continue Learning
What Is Endotoxin Testing and Why Does It Matter?
A Certificate of Analysis may report “Endotoxin: <0.1 EU/mL.” Here's what Endotoxin Units mean, why endotoxin testing isn't sterility testing, and what a result like that does — and doesn't — establish.
What Is Extracellular Vesicle Concentration vs. Total Particle Count?
Particle concentration tells you how many measured particles are present per unit volume. Total particle count tells you how many are associated with the entire defined volume. They're related — but not the same.
Understanding Extracellular Vesicle Characterization and Testing
Characterization is how laboratories measure and describe different properties of an extracellular-vesicle preparation — particle count, particle size, EV-associated markers, total protein and zeta potential — and why no single test describes everything.
How to Read an Exosome Certificate of Analysis (COA)
A plain-English walkthrough of an extracellular-vesicle Certificate of Analysis: lot numbers, analytical methods, particle concentration, particle size, characterization, specifications and results.